Ashby Daniels

Log charts make the gap look smaller than it is

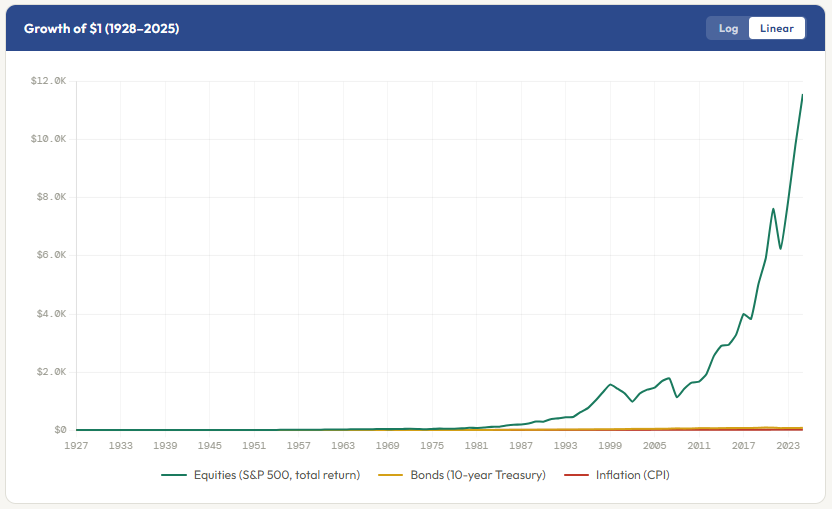
The problem with log-scale charts like the first one below is that they make the returns look much closer than they actually are. The second chart shows roughly the same data (mine only goes back to 1928 and doesn't include small-cap, etc.), but in linear form. As you can see, the difference in returns is so stark that bonds and inflation look like they're part of the x-axis as equities ran away from both over time.
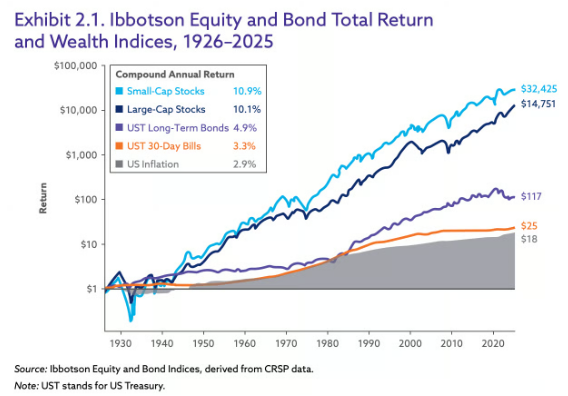
Ibbotson log-scale chart of growth of $1 from 1926 to 2025: small-cap stocks $32,425, large-cap stocks $14,751, long-term Treasury bonds $117, 30-day T-bills $25, inflation $18.
Log scale. Ibbotson Equity and Bond Indices, 1926–2025. Source: Ibbotson, Siegel, and Idzorek, Exponential Wealth, Exhibit 2.1. CFA Institute Research Foundation.
Linear-scale chart of growth of $1 from 1928 to 2025: the S&P 500 rises to about $11,500 while bonds and inflation stay flat near zero.
Linear scale. Growth of $1, 1928–2025. Market Return Data.

For investing time horizons measured in decades, be sure to do the math on what you're giving up to avoid equity's temporary (in the US, historically always temporary) volatility. It's far, far greater than what most people think.
Is inflation really high right now?

I created a new inflation calculator on the Market Return Data site.

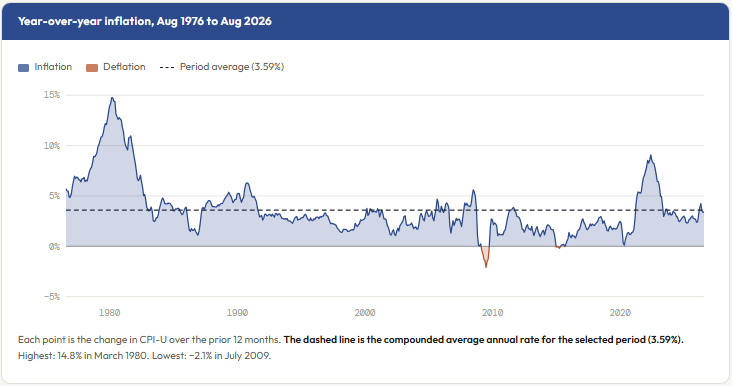
You can pick any period, see how inflation moved over time, and compare today's rate with the compounded average for that period.

For instance, the last 50 years show large changes in inflation, and August's 3.4% was slightly below the 50-year average of 3.59%. So, for everyone in the media saying or implying that inflation is abnormally high today, the long-term data doesn't necessarily support that position.

Year-over-year US inflation from August 1976 to August 2026, peaking at 14.8% in March 1980 and dipping to -2.1% in July 2009, with a dashed line marking the 3.59% compounded average for the period.
Year-over-year CPI-U inflation, August 1976 to August 2026. Market Return Data.

Why this blog exists

For most of my career, my writing has been for other people's audiences. As an advisor, I wrote for clients. Today most of what I write is for advisors to share with theirs.

This blog is where I write for myself. Plenty of it will be about investing, since that's what I think about most. The rest will be about whatever has my attention that week.

Most posts will be short. Every one shows up here in full, and in your inbox if you subscribe. Nothing to click through to read the rest.

If something here is useful, or you think I've got it wrong, reply and tell me. I read every reply.